
Lorem ipsum dolor sit amet, consectetur adipiscing elit. Ut elit tellus, luctus nec ullamcorper mattis, pulvinar dapibus leo.
John DoeCEO 
Lorem ipsum dolor sit amet, consectetur adipiscing elit. Ut elit tellus, luctus nec ullamcorper mattis, pulvinar dapibus leo.
John DoeCEO
Lorem ipsum dolor sit amet, consectetur adipiscing elit. Ut elit tellus, luctus nec ullamcorper mattis, pulvinar dapibus leo.
John DoeCEO
Learner's Career Outcome

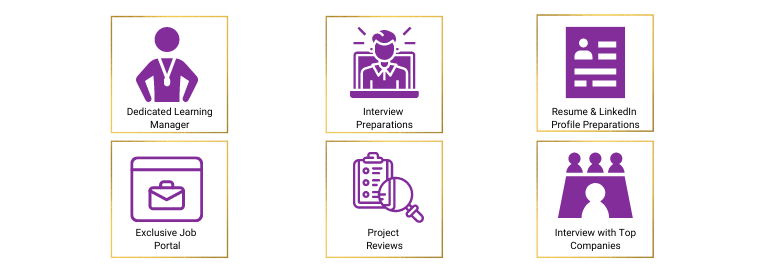
Career Services
Our Alumni Works At

Mentors Pool Experience


Very interactive session, It was a very interesting session. There was a lot of stuff to learn, analyze and implement in our career. I want to give 10/10 to a mentor pool for their experts.

Very good,wonderful explanation by trainer, They did handsOn based on real time scenarios Improved my skills Highly recommended. The most important thing in training is hand-on and the training was 80- 85 % handson that's the plus point of Mentors Pool

Trainer explains each and every concept with perfect real time examples, which makes it really easy to understand. I gained more knowledge through him. The way of explaining is awesome.

The way the trainer explained to me is very interactive, he solved all my queries with perfect examples. Helped me in cracking the TCS interview. I am very grateful that I came across Mentors Pool